* feat: improve code

* feat: update docs

* feat: update docs

* Update index.md

* Update features.md

* Update when.md

* Update contributing.md

* Update translations.md

* feat: clean up

* Add files via upload

* Update the-first-app.md

* Update plugins.md

* Update a-b-c.md

* Update blocks.md

* feat: update docs

* Add files via upload

* Update charts.md

* feat: update navs

* Update index.md

* Update index.md

* Update features.md

* Update index.md

* Update docker-compose.md

* Update create-nocobase-app.md

* Update git-clone.md

* Update contributing.md

* Update translations.md

* Update plugins.md

* Update the-first-app.md

* Add files via upload

* Update charts.md

* Update charts.md

* Update a-b-c.md

* Update collections.md

* Update menus.md

* Update menus.md

Co-authored-by: Zhou <zhou.working@gmail.com>
3.6 KiB
Executable File
图表
目前,NocoBase 图表区块需要通过配置文件或编写代码来实现。图表库使用的是 g2plot,理论上支持 https://g2plot.antv.vision/en/examples/gallery 上的所有图表。目前可以配置的图表包括:
- 柱状图
- 条形图
- 折线图
- 饼图
- 面积图
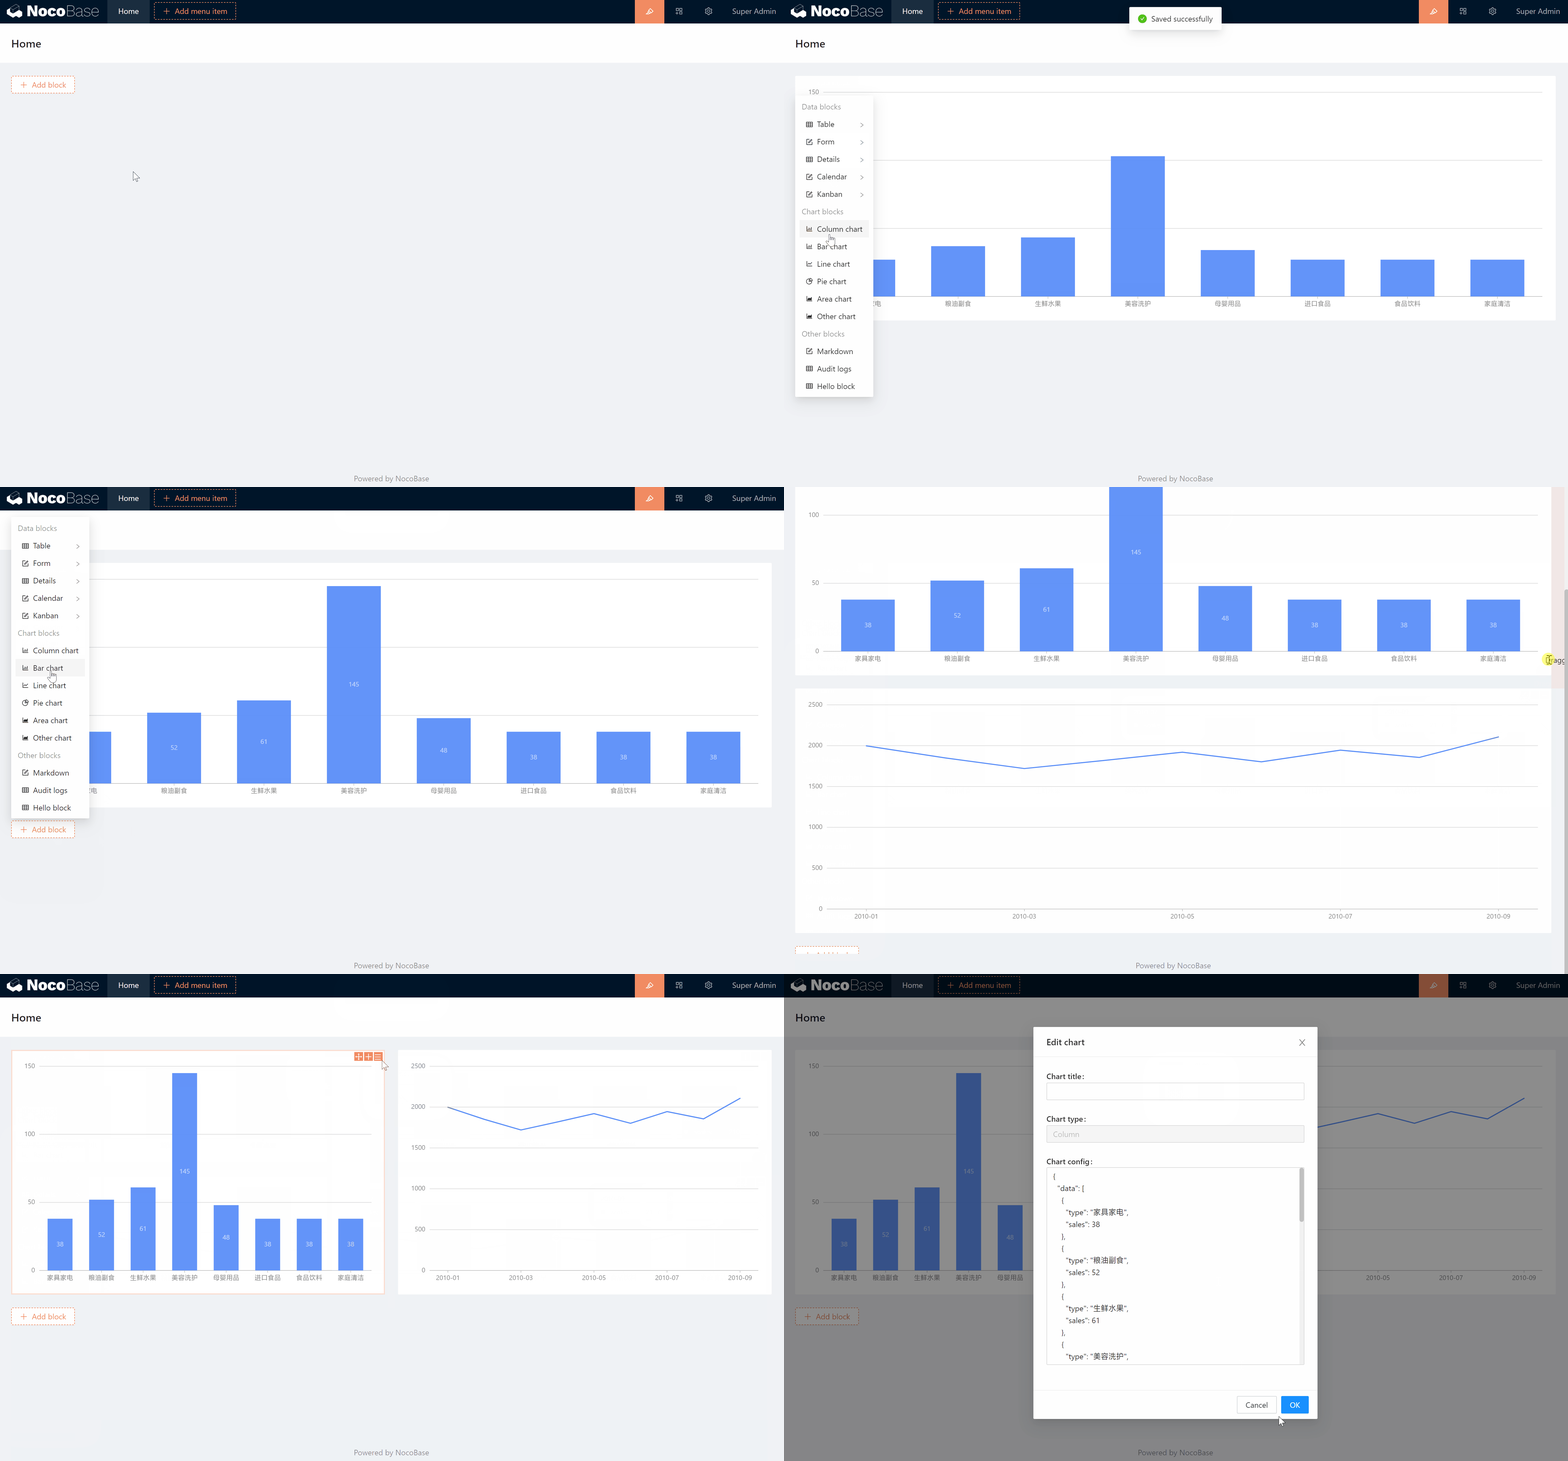
添加和编辑图表
图表配置
初始化的图表配置是静态的 JSON 数据
{
  "data": [
    {
      "type": "furniture & appliances",
      "sales": 38
    },
    {
      "type": "食品油副食",
      "sales": 52
    },
    {
      "type": "Fresh Fruit",
      "sales": 61
    },
    {
      "type": "美容洗护",
      "sales": 145
    },
    {
      "type": "Maternity & Baby Products",
      "sales": 48
    },
    {
      "type": "Imported Food",
      "sales": 38
    },
    {
      "type": "Food & Beverage",
      "sales": 38
    },
    {
      "type": "Home Cleaning",
      "sales": 38
    }
  ],
  "xField": "type",
  "yField": "sales",
  "label": {
    "position": "middle",
    "style": {
      "fill": "#FFFFFF",
      "opacity": 0.6
    }
  },
  "xAxis": {
    "label": {
      "autoHide": true,
      "autoRotate": false
    }
  },
  "meta": {
    "type": {
      "alias": "category"
    },
    "sales": {
      "alias": "sales"
    }
  }
}
data 支持表达式的写法,NocoBase 内置了 requestChartData(config) 函数,用于自定义图表数据的请求。Config 参数说明见: https://github.com/axios/axios#request-config
示例:
{
  "data": "{{requestChartData({ url: 'collectionName:getColumnChartData' })}}",
  "xField": "type",
  "yField": "sales",
  "label": {
    "position": "middle",
    "style": {
      "fill": "#FFFFFF",
      "opacity": 0.6
    }
  },
  "xAxis": {
    "label": {
      "autoHide": true,
      "autoRotate": false
    }
  },
  "meta": {
    "type": {
      "alias": "category"
    },
    "sales": {
      "alias": "sales"
    }
  }
}
HTTP API 示例:
GET /api/collectionName:getColumnChartData

Response Body
{
    "data": [
    {
      "type": "furniture & appliances",
      "sales": 38
    },
    {
      "type": "食品油副食",
      "sales": 52
    },
    {
      "type": "Fresh Fruit",
      "sales": 61
    },
    {
      "type": "美容洗护",
      "sales": 145
    },
    {
      "type": "Maternity & Baby Products",
      "sales": 48
    },
    {
      "type": "Imported Food",
      "sales": 38
    },
    {
      "type": "Food & Beverage",
      "sales": 38
    },
    {
      "type": "Home Cleaning",
      "sales": 38
    }
  ]
}
Server 端实现
为名为 collectionName 的数据表,添加自定义的 getColumnChartData 方法:
app.resourcer.registerActionHandlers({
  'collectionName:getColumnChartData': (ctx, next) => {
    // The data to be output
    ctx.body = [];
    await next();
  },
});
视频
静态数据
https://user-images.githubusercontent.com/1267426/198877269-1c56562b-167a-4808-ada3-578f0872bce1.mp4
动态数据
https://user-images.githubusercontent.com/1267426/198877336-6bd85f0b-17c5-40a5-9442-8045717cc7b0.mp4
更多图表
理论上支持 https://g2plot.antv.vision/en/examples/gallery 上的所有图表
https://user-images.githubusercontent.com/1267426/198877347-7fc2544c-b938-4e34-8a83-721b3f62525e.mp4
JS 表达式
Syntax
{
  "key1": "{{ js expression }}"
}
https://user-images.githubusercontent.com/1267426/198877361-808a51cc-6c91-429f-8cfc-8ad7f747645a.mp4
